From customer satisfaction to revenue, SaaS companies have many factors to worry about when it comes to keeping their business not only afloat, but also thriving. One such factor: What is your churn rate, and what can you do to decrease it? Reality check: these are critical questions, but they don’t have such a straightforward answer.
In a perfect world, your churn rate is, well, perfect. That could mean zero churn, or churn just on the accounts that maybe weren’t a perfect fit from day one. But we all know that’s not often the case. Challenges arise with bleed points for customers, renewal periods can result in a massive uptick in churn, and sometimes, it’s just hard to understand what it is that’s motivating your customers to stay — or churn.
Although there is no one single agreed-upon answer of what makes a churn rate ‘good’, or even ‘acceptable’, there are a couple of widely utilized ways of measuring churn: dollar churn rate and logo churn rate. Dollar churn rate is calculated in dollars lost (whether from customers downgrading or terminating), and logo churn rate is calculated in number of customers lost.
Other Factors to Consider
Depending on your source, the acceptable range for rate of churn for SaaS companies is about five to ten percent annually. However, churn rate should not be the only factor a company uses to assess its success. Businesses should also take note of their customer growth rate, the expected customer lifetime (how long they will remain your customer), and customer lifetime value. In other words, a lower churn rate is more desirable, but a higher one does not necessarily demonstrate a company’s inability to sustain successful operations.
There are many factors to consider if your churn rate is keeping you up at night. What is the typical buying behavior of your target customer or your average customer? Is there a seasonal aspect to your business or an expectation of repeat purchases? Depending on your answers to these questions and more, that five to ten percent average may or may not apply to your business and your customers. But, if your churn rate is higher than your rate of new customer acquisitions and upgrades, this is cause for concern. Here are a few things to look for when evaluating if your business plan is in need of restructuring:
- Your churn rate increases monthly or annually
- Your churn rate increases at each renewal period (checking in with your customers can really help with this one)
- The value of customers who leave your business is equal to or greater than that of those you acquire
- You have a low Lifetime Value (unless that fits your business model).
Customer Retention
As Customer Success rockstar Lincoln Murphy puts it, “Honestly, there’s nothing magical to reducing churn, it’s just ensuring that your customers continue to realize value from your service.” Once a company is able to understand how and why it is losing customers, it is then able to improve any associated factors that are within its control. According to the Harvard Business Review, increasing customer retention rates by just five percent can increase profits by anywhere from 25 percent to 90 percent. Not to mention: acquiring a new customer is five to 25 times more expensive than retaining one.
Although your churn rate can be indicative of the status of your business, it’s not the be-all end-all metric for your business’s health. Some businesses expect a high churn rate and can still be successful with that model, and on the flip side, a myriad of other issues can plague a business with even the most enviably low churn rate. Use churn rate to help you better forecast and analyze your business’s health and the rate at which your customers realize the value of your product or service — or don’t.
Determining Your Churn Rate
Already calling your analytics department for help determining your current churn rate? Put that phone down. At its core, it’s a simple formula. Simply subtract the number of customers at the end of any given period from the customers you started that period with. Divide that number by the users at the beginning of the period. That’s your logo churn rate.
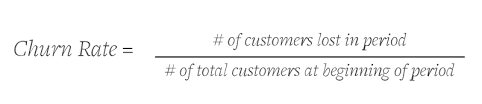
The above formula is extremely basic — you’ll want to dive into monthly, annual, and probable monthly churn, all of which are more involved, nuanced formulas. But you’ve got to understand where you are to map where you’re going — the above formula provides an easy way to check the pulse of your current churn. Similarly, calculate your dollar churn rate by replacing the number of customers with revenue earned during the time period you’re measuring, and follow the same logic.
At the End of the Day
Understanding your churn rate is the first step in optimizing it. Along the way, you’ll encounter valuable information regarding customer pain points — at what point they’re leaving your business or not renewing, what’s getting in the way of adoption, understanding usage patterns, and more.
It makes the Customer Success nerd in us jump for joy. Understanding the journey from onboarding to advocacy can result in reduced churn, quicker Time to Value, and increased rates of adoption and renewal. It really is all connected — and it can all start with understanding your churn rate.